
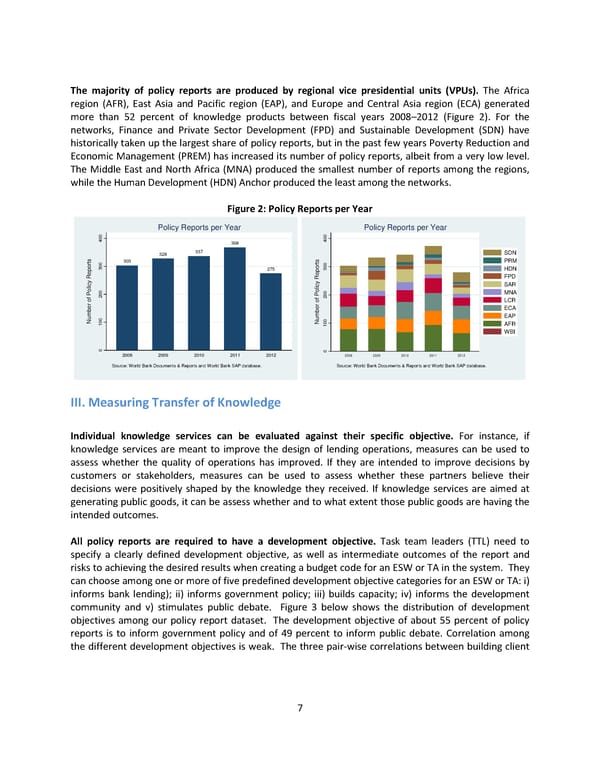
The majority of policy reports are produced by regional vice presidential units (VPUs). The Africa region (AFR), East Asia and Pacific region (EAP), and Europe and Central Asia region (ECA) generated more than 52 percent of knowledge products between fiscal years 2008–2012 (Figure 2). For the networks, Finance and Private Sector Development (FPD) and Sustainable Development (SDN) have historically taken up the largest share of policy reports, but in the past few years Poverty Reduction and Economic Management (PREM) has increased its number of policy reports, albeit from a very low level. The Middle East and North Africa (MNA) produced the smallest number of reports among the regions, while the Human Development (HDN) Anchor produced the least among the networks. Figure 2: Policy Reports per Year Policy Reports per Year Policy Reports per Year 0 0 40 368 40 328 337 SDN s 303 s PRM t 0 t 0 por 30 275 por 30 HDN Re Re FPD y y SAR ic ic ol 0 ol 0 MNA P 20 P 20 f f o o LCR r r ECA be be m m EAP Nu 0 Nu 0 10 10 AFR WBI 0 0 2008 2009 2010 2011 2012 2008 2009 2010 2011 2012 Source: World Bank Documents & Reports and World Bank SAP database. Source: World Bank Documents & Reports and World Bank SAP database. III. Measuring Transfer of Knowledge Individual knowledge services can be evaluated against their specific objective. For instance, if knowledge services are meant to improve the design of lending operations, measures can be used to assess whether the quality of operations has improved. If they are intended to improve decisions by customers or stakeholders, measures can be used to assess whether these partners believe their decisions were positively shaped by the knowledge they received. If knowledge services are aimed at generating public goods, it can be assess whether and to what extent those public goods are having the intended outcomes. All policy reports are required to have a development objective. Task team leaders (TTL) need to specify a clearly defined development objective, as well as intermediate outcomes of the report and risks to achieving the desired results when creating a budget code for an ESW or TA in the system. They can choose among one or more of five predefined development objective categories for an ESW or TA: i) informs bank lending); ii) informs government policy; iii) builds capacity; iv) informs the development community and v) stimulates public debate. Figure 3 below shows the distribution of development objectives among our policy report dataset. The development objective of about 55 percent of policy reports is to inform government policy and of 49 percent to inform public debate. Correlation among the different development objectives is weak. The three pair-wise correlations between building client 7
 Which World Bank Reports Are Widely Read? Page 12 Page 14