
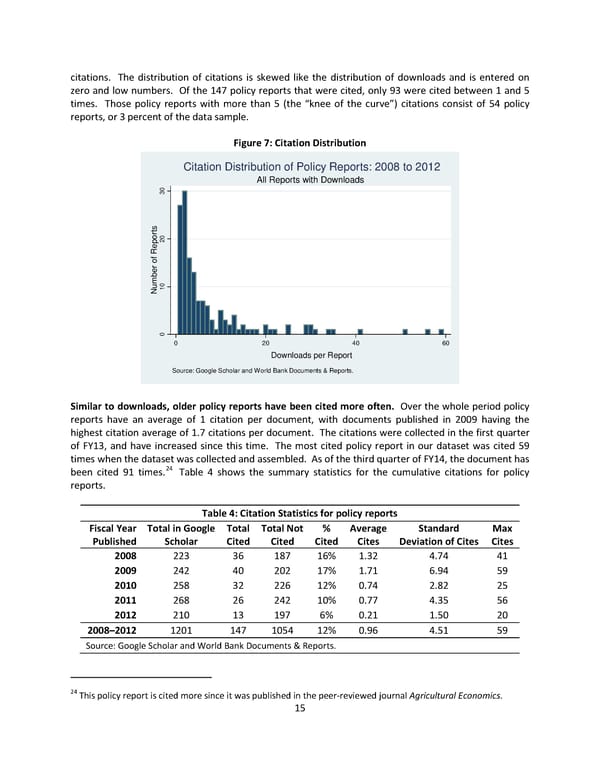
citations. The distribution of citations is skewed like the distribution of downloads and is entered on zero and low numbers. Of the 147 policy reports that were cited, only 93 were cited between 1 and 5 times. Those policy reports with more than 5 (the “knee of the curve”) citations consist of 54 policy reports, or 3 percent of the data sample. Figure 7: Citation Distribution Citation Distribution of Policy Reports: 2008 to 2012 All Reports with Downloads 30 s t or20 ep R of er b um10 N 0 0 20 40 60 Downloads per Report Source: Google Scholar and World Bank Documents & Reports. Similar to downloads, older policy reports have been cited more often. Over the whole period policy reports have an average of 1 citation per document, with documents published in 2009 having the highest citation average of 1.7 citations per document. The citations were collected in the first quarter of FY13, and have increased since this time. The most cited policy report in our dataset was cited 59 times when the dataset was collected and assembled. As of the third quarter of FY14, the document has been cited 91 times.24 Table 4 shows the summary statistics for the cumulative citations for policy reports. Table 4: Citation Statistics for policy reports Fiscal Year Total in Google Total Total Not % Average Standard Max Published Scholar Cited Cited Cited Cites Deviation of Cites Cites 2008 223 36 187 16% 1.32 4.74 41 2009 242 40 202 17% 1.71 6.94 59 2010 258 32 226 12% 0.74 2.82 25 2011 268 26 242 10% 0.77 4.35 56 2012 210 13 197 6% 0.21 1.50 20 2008–2012 1201 147 1054 12% 0.96 4.51 59 Source: Google Scholar and World Bank Documents & Reports. 24 This policy report is cited more since it was published in the peer-reviewed journal Agricultural Economics. 15
 Which World Bank Reports Are Widely Read? Page 20 Page 22