
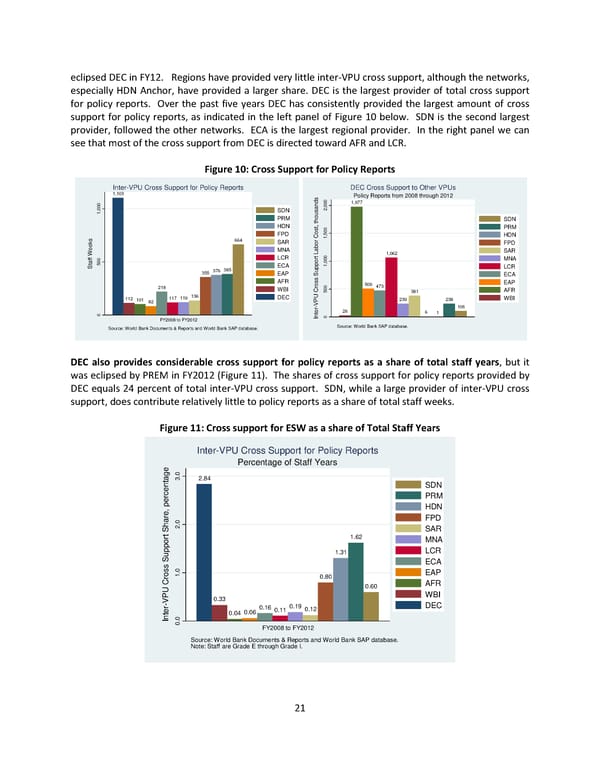
eclipsed DEC in FY12. Regions have provided very little inter-VPU cross support, although the networks, especially HDN Anchor, have provided a larger share. DEC is the largest provider of total cross support for policy reports. Over the past five years DEC has consistently provided the largest amount of cross support for policy reports, as indicated in the left panel of Figure 10 below. SDN is the second largest provider, followed the other networks. ECA is the largest regional provider. In the right panel we can see that most of the cross support from DEC is directed toward AFR and LCR. Figure 10: Cross Support for Policy Reports Inter-VPU Cross Support for Policy Reports DEC Cross Support to Other VPUs 1,103 s Policy Reports from 2008 through 2012 d 00 1,977 00 n 0 0 SDN a 2, 1, s u PRM o SDN h t HDN , PRM st 00 FPD o 5 HDN s 664 C 1, k SAR r FPD e o e b MNA a 1,062 SAR W L ff 0 LCR rt 00 MNA ta 50 o 0 ECA p 1, LCR S 376 385 p 355 EAP Su ECA AFR ss 509 EAP 218 WBI ro 0 473 AFR C 50 381 112 101 117 119 136 DEC 239 238 WBI 82 r-VPU 26 106 e 6 0 t 1 n 0 FY2008 to FY2012 I Source: World Bank Documents & Reports and World Bank SAP database. Source: World Bank SAP database. DEC also provides considerable cross support for policy reports as a share of total staff years, but it was eclipsed by PREM in FY2012 (Figure 11). The shares of cross support for policy reports provided by DEC equals 24 percent of total inter-VPU cross support. SDN, while a large provider of inter-VPU cross support, does contribute relatively little to policy reports as a share of total staff weeks. Figure 11: Cross support for ESW as a share of Total Staff Years Inter-VPU Cross Support for Policy Reports e Percentage of Staff Years g 0 a 3. 2.84 t n SDN rce PRM e p HDN , re FPD a 0 Sh 2. SAR 1.62 rt MNA o p p 1.31 LCR ECA ss Su0 EAP ro 1. 0.80 C AFR 0.60 0.33 WBI r-VPU 0.16 0.11 0.19 0.12 DEC e 0.06 t 0.04 n 0 I 0. FY2008 to FY2012 Source: World Bank Documents & Reports and World Bank SAP database. Note: Staff are Grade E through Grade I. 21
 Which World Bank Reports Are Widely Read? Page 26 Page 28