
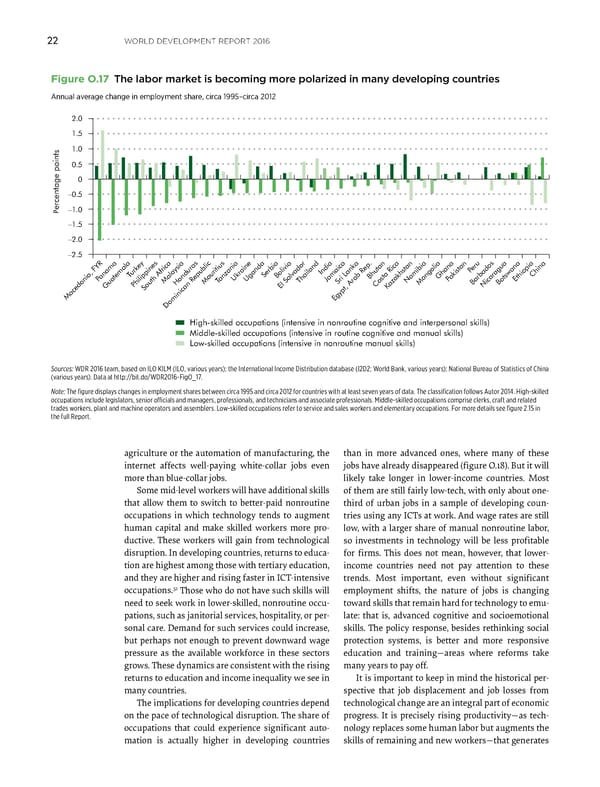
WORLD DEVELOPMENT REPORT 2016 22 Figure O.17 The labor market is becoming more polarized in many developing countries Annual average change in employment share, circa 1995–circa 2012 2.0 1.5 1.0 0.5 0 –0.5 ercentage points–1.0 P –1.5 –2.0 –2.5 rkey eru u India anka kistan P China T Serbia nzania Bolivia Bhutan Ghana anama a Ukraine a Ethiopia P Malaysia T Uganda Thailand Jamaica Namibia P Honduras Mauritius Sri L azakhstan Mongolia Barbados Botswana Guatemala Philippines El Salvador Costa Rica Nicaragua South Africa K Macedonia, FYR Egypt, Arab Rep. Dominican Republic High-skilled occupations (intensive in nonroutine cognitive and interpersonal skills) Middle-skilled occupations (intensive in routine cognitive and manual skills) Low-skilled occupations (intensive in nonroutine manual skills) Sources: WDR 2016 team, based on ILO KILM (ILO, various years); the International Income Distribution database (I2D2; World Bank, various years); National Bureau of Statistics of China (various years). Data at http://bit.do/WDR2016-FigO_17. Note: The figure displays changes in employment shares between circa 1995 and circa 2012 for countries with at least seven years of data. The classification follows Autor 2014. High-skilled occupations include legislators, senior officials and managers, professionals, and technicians and associate professionals. Middle-skilled occupations comprise clerks, craft and related trades workers, plant and machine operators and assemblers. Low-skilled occupations refer to service and sales workers and elementary occupations. For more details see figure 2.15 in the full Report. agriculture or the automation of manufacturing, the than in more advanced ones, where many of these internet affects well-paying white-collar jobs even jobs have already disappeared (figure O.18). But it will more than blue-collar jobs. likely take longer in lower-income countries. Most Some mid-level workers will have additional skills of them are still fairly low-tech, with only about one- that allow them to switch to better-paid nonroutine third of urban jobs in a sample of developing coun- occupations in which technology tends to augment tries using any ICTs at work. And wage rates are still human capital and make skilled workers more pro- low, with a larger share of manual nonroutine labor, ductive. These workers will gain from technological so investments in technology will be less profitable disruption. In developing countries, returns to educa- for firms. This does not mean, however, that lower - tion are highest among those with tertiary education, income countries need not pay attention to these and they are higher and rising faster in ICT-intensive trends. Most important, even without significant occupations.32 employment shifts, the nature of jobs is changing Those who do not have such skills will need to seek work in lower-skilled, nonroutine occu- toward skills that remain hard for technology to emu- pations, such as janitorial services, hospitality, or per- late: that is, advanced cognitive and socioemotional sonal care. Demand for such services could increase, skills. The policy response, besides rethinking social but perhaps not enough to prevent downward wage protection systems, is better and more responsive pressure as the available workforce in these sectors education and training—areas where reforms take grows. These dynamics are consistent with the rising many years to pay off. returns to education and income inequality we see in It is important to keep in mind the historical per- many countries. spective that job displacement and job losses from The implications for developing countries depend technological change are an integral part of economic on the pace of technological disruption. The share of progress. It is precisely rising productivity—as tech- occupations that could experience significant auto- nology replaces some human labor but augments the mation is actually higher in developing countries skills of remaining and new workers—that generates
 World Development Report 2016 Page 35 Page 37