
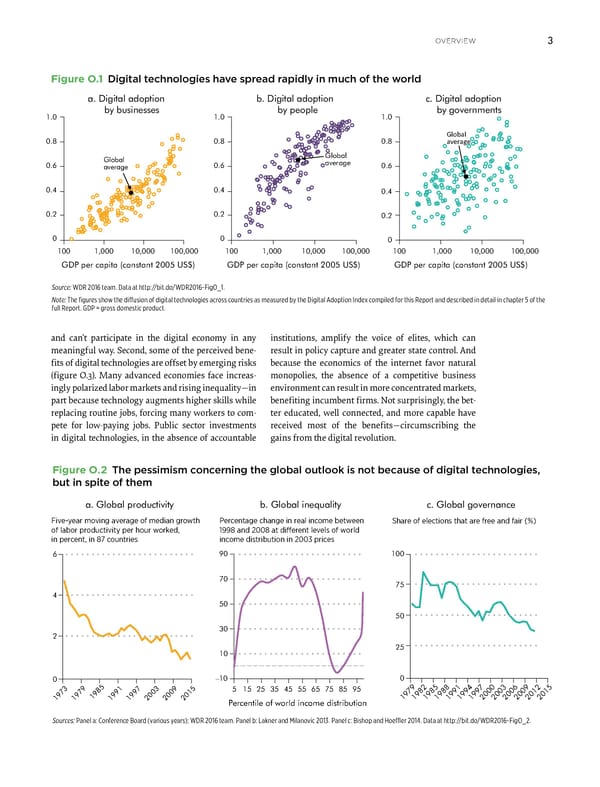
overview 3 Figure O.1 Digital technologies have spread rapidly in much of the world a. Digital adoption b. Digital adoption c. Digital adoption by businesses by people by governments 1.0 1.0 1.0 Global 0.8 0.8 0.8 average Global Global 0.6 0.6 average 0.6 average 0.4 0.4 0.4 0.2 0.2 0.2 0 0 0 100 1,000 10,000 100,000 100 1,000 10,000 100,000 100 1,000 10,000 100,000 GDP per capita (constant 2005 US$) GDP per capita (constant 2005 US$) GDP per capita (constant 2005 US$) Source: WDR 2016 team. Data at http://bit.do/WDR2016-FigO_1. Note: The figures show the diffusion of digital technologies across countries as measured by the Digital Adoption Index compiled for this Report and described in detail in chapter 5 of the full Report. GDP = gross domestic product. and can’t participate in the digital economy in any institutions, amplify the voice of elites, which can meaningful way. Second, some of the perceived bene- result in policy capture and greater state control. And fits of digital technologies are offset by emerging risks because the economics of the internet favor natural (figure O.3). Many advanced economies face increas- monopolies, the absence of a competitive business ingly polarized labor markets and rising inequality—in environment can result in more concentrated markets, part because technology augments higher skills while benefiting incumbent firms. Not surprisingly, the bet- replacing routine jobs, forcing many workers to com- ter educated, well connected, and more capable have pete for low-paying jobs. Public sector investments received most of the benefits—circumscribing the in digital technologies, in the absence of accountable gains from the digital revolution. Figure O.2 The pessimism concerning the global outlook is not because of digital technologies, but in spite of them a. Global productivity b. Global inequality c. Global governance Five-year moving average of median growth Percentage change in real income between hare of elections that are free and fair of labor productivity per hour worked, 1998 and 8 at different levels of world in percent, in 87 countries income distribution in prices 6 90 100 70 75 4 50 50 30 2 25 10 0 –10 0 73 79 85 91 97 03 09 15 515253545 55 65 75 85 95 19 19 19 19 19 20 20 20 Percentile of world income distribution 1979198219851988199119941997200020032006200920122015 Sources: Panel a: Conference Board (various years); WDR 2016 team. Panel b: Lakner and Milanovic 2013. Panel c: Bishop and Hoeffler 2014. Data at http://bit.do/WDR2016-FigO_2.
 World Development Report 2016 Page 13 Page 15