
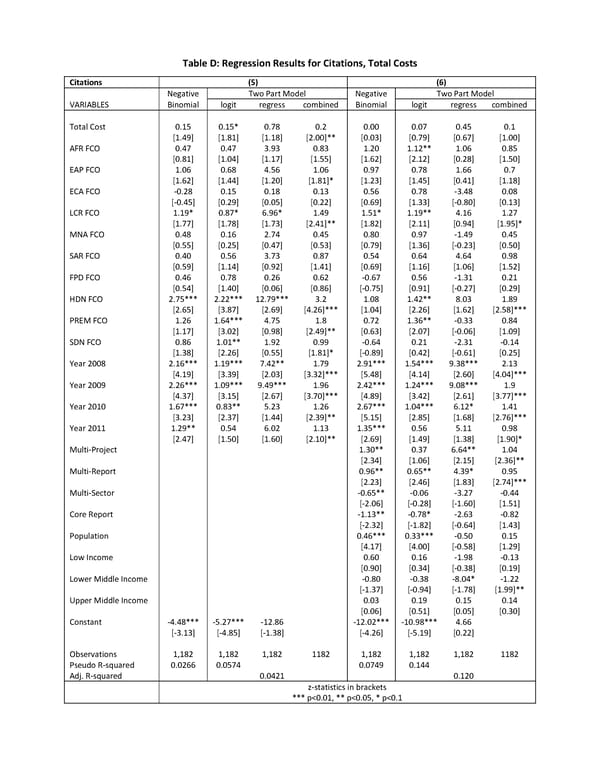
Table D: Regression Results for Citations, Total Costs Citations (5) (6) Negative Two Part Model Negative Two Part Model VARIABLES Binomial logit regress combined Binomial logit regress combined Total Cost 0.15 0.15* 0.78 0.2 0.00 0.07 0.45 0.1 [1.49] [1.81] [1.18] [2.00]** [0.03] [0.79] [0.67] [1.00] AFR FCO 0.47 0.47 3.93 0.83 1.20 1.12** 1.06 0.85 [0.81] [1.04] [1.17] [1.55] [1.62] [2.12] [0.28] [1.50] EAP FCO 1.06 0.68 4.56 1.06 0.97 0.78 1.66 0.7 [1.62] [1.44] [1.20] [1.81]* [1.23] [1.45] [0.41] [1.18] ECA FCO -0.28 0.15 0.18 0.13 0.56 0.78 -3.48 0.08 [-0.45] [0.29] [0.05] [0.22] [0.69] [1.33] [-0.80] [0.13] LCR FCO 1.19* 0.87* 6.96* 1.49 1.51* 1.19** 4.16 1.27 [1.77] [1.78] [1.73] [2.41]** [1.82] [2.11] [0.94] [1.95]* MNA FCO 0.48 0.16 2.74 0.45 0.80 0.97 -1.49 0.45 [0.55] [0.25] [0.47] [0.53] [0.79] [1.36] [-0.23] [0.50] SAR FCO 0.40 0.56 3.73 0.87 0.54 0.64 4.64 0.98 [0.59] [1.14] [0.92] [1.41] [0.69] [1.16] [1.06] [1.52] FPD FCO 0.46 0.78 0.26 0.62 -0.67 0.56 -1.31 0.21 [0.54] [1.40] [0.06] [0.86] [-0.75] [0.91] [-0.27] [0.29] HDN FCO 2.75*** 2.22*** 12.79*** 3.2 1.08 1.42** 8.03 1.89 [2.65] [3.87] [2.69] [4.26]*** [1.04] [2.26] [1.62] [2.58]*** PREM FCO 1.26 1.64*** 4.75 1.8 0.72 1.36** -0.33 0.84 [1.17] [3.02] [0.98] [2.49]** [0.63] [2.07] [-0.06] [1.09] SDN FCO 0.86 1.01** 1.92 0.99 -0.64 0.21 -2.31 -0.14 [1.38] [2.26] [0.55] [1.81]* [-0.89] [0.42] [-0.61] [0.25] Year 2008 2.16*** 1.19*** 7.42** 1.79 2.91*** 1.54*** 9.38*** 2.13 [4.19] [3.39] [2.03] [3.32]*** [5.48] [4.14] [2.60] [4.04]*** Year 2009 2.26*** 1.09*** 9.49*** 1.96 2.42*** 1.24*** 9.08*** 1.9 [4.37] [3.15] [2.67] [3.70]*** [4.89] [3.42] [2.61] [3.77]*** Year 2010 1.67*** 0.83** 5.23 1.26 2.67*** 1.04*** 6.12* 1.41 [3.23] [2.37] [1.44] [2.39]** [5.15] [2.85] [1.68] [2.76]*** Year 2011 1.29** 0.54 6.02 1.13 1.35*** 0.56 5.11 0.98 [2.47] [1.50] [1.60] [2.10]** [2.69] [1.49] [1.38] [1.90]* Multi-Project 1.30** 0.37 6.64** 1.04 [2.34] [1.06] [2.15] [2.36]** Multi-Report 0.96** 0.65** 4.39* 0.95 [2.23] [2.46] [1.83] [2.74]*** Multi-Sector -0.65** -0.06 -3.27 -0.44 [-2.06] [-0.28] [-1.60] [1.51] Core Report -1.13** -0.78* -2.63 -0.82 [-2.32] [-1.82] [-0.64] [1.43] Population 0.46*** 0.33*** -0.50 0.15 [4.17] [4.00] [-0.58] [1.29] Low Income 0.60 0.16 -1.98 -0.13 [0.90] [0.34] [-0.38] [0.19] Lower Middle Income -0.80 -0.38 -8.04* -1.22 [-1.37] [-0.94] [-1.78] [1.99]** Upper Middle Income 0.03 0.19 0.15 0.14 [0.06] [0.51] [0.05] [0.30] Constant -4.48*** -5.27*** -12. 86 -12.02*** -10.98*** 4.66 [-3.13] [-4.85] [-1.38] [-4.26] [-5.19] [0.22] Observations 1,182 1,182 1,182 1182 1,182 1,182 1,182 1182 Pseudo R-squared 0.0266 0.0574 0.0749 0.144 Adj. R-squared 0.0421 0.120 z-statistics in brackets *** p<0.01, ** p<0.05, * p<0.1
 Which World Bank Reports Are Widely Read? Page 35 Page 37