
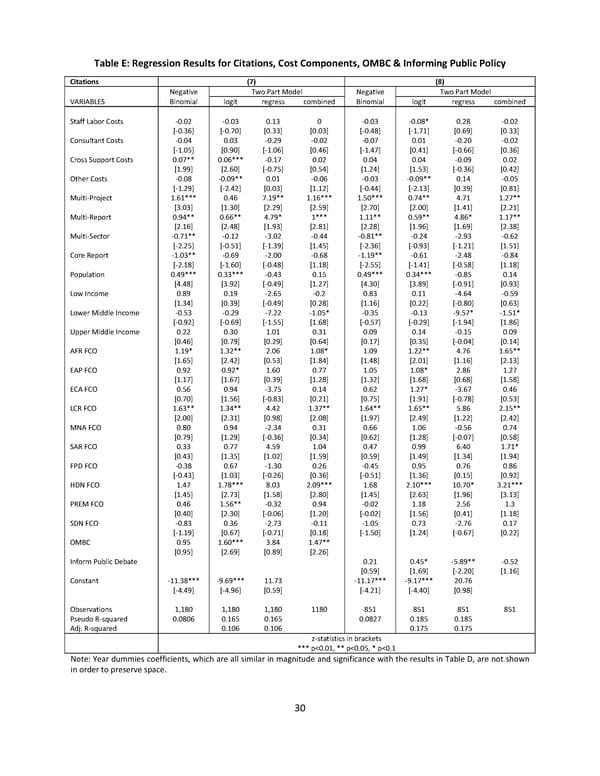
Table E: Regression Results for Citations, Cost Components, OMBC & Informing Public Policy Citations (7) (8) Negative Two Part Model Negative Two Part Model VARIABLES Binomial logit regress combined Binomial logit regress combined Staff Labor Costs -0.02 -0.03 0.13 0 -0.03 -0.08* 0.28 -0.02 [-0.36] [-0.70] [0.33] [0.03] [-0.48] [-1.71] [0.69] [0.33] Consultant Costs -0.04 0.03 -0.29 -0.02 -0.07 0.01 -0.20 -0.02 [-1.05] [0.90] [-1.06] [0.46] [-1.47] [0.41] [-0.66] [0.36] Cross Support Costs 0.07** 0.06*** -0.17 0.02 0.04 0.04 -0.09 0.02 [1.99] [2.60] [-0.75] [0.54] [1.24] [1.53] [-0.36] [0.42] Other Costs -0.08 -0.09** 0.01 -0.06 -0.03 -0.09** 0.14 -0.05 [-1.29] [-2.42] [0.03] [1.12] [-0.44] [-2.13] [0.39] [0.81] Multi-Project 1.61*** 0.46 7.19** 1.16*** 1.50*** 0.74** 4.71 1.27** [3.03] [1.30] [2.29] [2.59] [2.70] [2.00] [1.41] [2.21] Multi-Report 0.94** 0.66** 4.79* 1*** 1.11** 0.59** 4.86* 1.17** [2.16] [2.48] [1.93] [2.81] [2.28] [1.96] [1.69] [2.38] Multi-Sector -0.71** -0.12 -3.02 -0.44 -0.81** -0.24 -2.93 -0.62 [-2.25] [-0.51] [-1.39] [1.45] [-2.36] [-0.93] [-1.21] [1.51] Core Report -1.03** -0.69 -2.00 -0.68 -1.19** -0.61 -2.48 -0.84 [-2.18] [-1.60] [-0.48] [1.18] [-2.55] [-1.41] [-0.58] [1.18] Population 0.49*** 0.33*** -0.43 0.15 0.49*** 0.34*** -0.85 0.14 [4.48] [3.92] [-0.49] [1.27] [4.30] [3.89] [-0.91] [0.93] Low Income 0.89 0.19 -2.65 -0.2 0.83 0.11 -4.64 -0.59 [1.34] [0.39] [-0.49] [0.28] [1.16] [0.22] [-0.80] [0.63] Lower Middle Income -0.53 -0.29 -7.22 -1.05* -0.35 -0.13 -9.57* -1.51* [-0.92] [-0.69] [-1.55] [1.68] [-0.57] [-0.29] [-1.94] [1.86] Upper Middle Income 0.22 0.30 1.01 0.31 0.09 0.14 -0.15 0.09 [0.46] [0.79] [0.29] [0.64] [0.17] [0.35] [-0.04] [0.14] AFR FCO 1.19* 1.32** 2.06 1.08* 1.09 1.22** 4.76 1.65** [1.65] [2.42] [0.53] [1.84] [1.48] [2.01] [1.16] [2.13] EAP FCO 0.92 0.92* 1.60 0.77 1.05 1.08* 2.86 1.27 [1.17] [1.67] [0.39] [1.28] [1.32] [1.68] [0.68] [1.58] ECA FCO 0.56 0.94 -3.75 0.14 0.62 1.27* -3.67 0.46 [0.70] [1.56] [-0.83] [0.21] [0.75] [1.91] [-0.78] [0.53] LCR FCO 1.63** 1.34** 4.42 1.37** 1.64** 1.65** 5.86 2.15** [2.00] [2.31] [0.98] [2.08] [1.97] [2.49] [1.22] [2.42] MNA FCO 0.80 0.94 -2.34 0.31 0.66 1.06 -0.56 0.74 [0.79] [1.29] [-0.36] [0.34] [0.62] [1.28] [-0.07] [0.58] SAR FCO 0.33 0.77 4.59 1.04 0.47 0.99 6.40 1.71* [0.43] [1.35] [1.02] [1.59] [0.59] [1.49] [1.34] [1.94] FPD FCO -0.38 0.67 -1.30 0.26 -0.45 0.95 0.76 0.86 [-0.43] [1.03] [-0.26] [0.36] [-0.51] [1.36] [0.15] [0.92] HDN FCO 1.47 1.78*** 8.03 2.09*** 1.68 2.10*** 10.70* 3.21*** [1.45] [2.73] [1.58] [2.80] [1.45] [2.63] [1.96] [3.13] PREM FCO 0.46 1.56** -0.32 0.94 -0.02 1.18 2.56 1.3 [0.40] [2.30] [-0.06] [1.20] [-0.02] [1.56] [0.41] [1.18] SDN FCO -0.83 0.36 -2.73 -0.11 -1.05 0.73 -2.76 0.17 [-1.19] [0.67] [-0.71] [0.18] [-1.50] [1.24] [-0.67] [0.22] OMBC 0.95 1.60*** 3.84 1.47** [0.95] [2.69] [0.89] [2.26] Inform Public Debate 0.21 0.45* -5.8 9** -0.52 [0.59] [1.69] [-2.20] [1.16] Constant -11.38*** -9.69*** 11. 73 -11.17*** -9.17*** 20.76 [-4.49] [-4.96] [0.59] [-4.21] [-4.40] [0.98] Observations 1,180 1,180 1,1 80 1180 851 851 85 1 851 Pseudo R-squared 0.0806 0.165 0.165 0.0827 0.185 0.185 Adj. R-squared 0.106 0.106 0.175 0.175 z-statistics in brackets *** p<0.01, ** p<0.05, * p<0.1 Note: Year dummies coefficients, which are all similar in magnitude and significance with the results in Table D, are not shown in order to preserve space. 30
 Which World Bank Reports Are Widely Read? Page 36 Page 38