
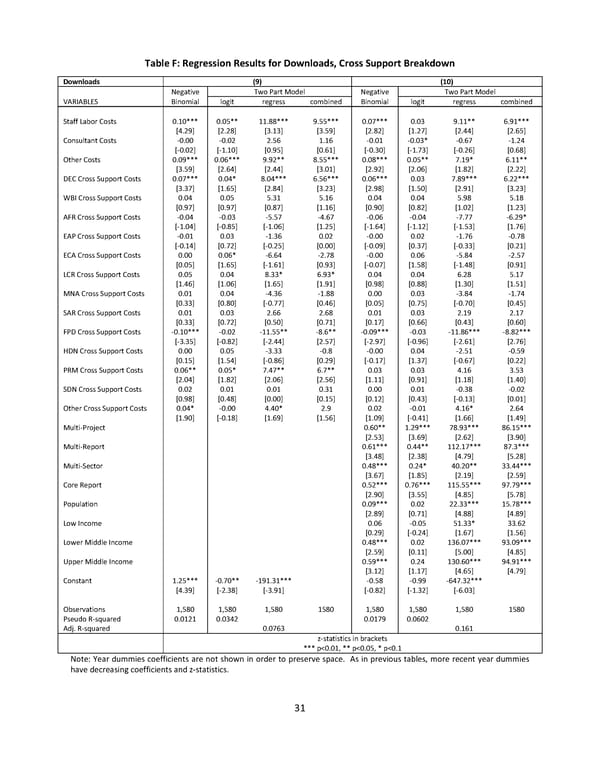
Table F: Regression Results for Downloads, Cross Support Breakdown Downloads (9) (10) Negative Two Part Model Negative Two Part Model VARIABLES Binomial logit regress combined Binomial logit regress combined Staff Labor Costs 0.10*** 0.05** 11.88*** 9.55*** 0.07*** 0.03 9.11** 6.91*** [4.29] [2.28] [3.13] [3.59] [2.82] [1.27] [2.44] [2.65] Consultant Costs -0.00 -0.02 2.56 1.16 -0.01 -0.03* -0.67 -1.24 [-0.02] [-1.10] [0.95] [0.61] [-0.30] [-1.73] [-0.26] [0.68] Other Costs 0.09*** 0.06*** 9.92** 8.55*** 0.08*** 0.05** 7.19* 6.11** [3.59] [2.64] [2.44] [3.01] [2.92] [2.06] [1.82] [2.22] DEC Cross Support Costs 0.07*** 0.04* 8.04*** 6.56*** 0.06*** 0.03 7.89*** 6.22*** [3.37] [1.65] [2.84] [3.23] [2.98] [1.50] [2.91] [3.23] WBI Cross Support Costs 0.04 0.05 5.31 5.16 0.04 0.04 5.98 5.18 [0.97] [0.97] [0.87] [1.16] [0.90] [0.82] [1.02] [1.23] AFR Cross Support Costs -0.04 -0.03 -5.57 -4.67 -0.06 -0.04 -7.77 -6.29* [-1.04] [-0.85] [-1.06] [1.25] [-1.64] [-1.12] [-1.53] [1.76] EAP Cross Support Costs -0.01 0.03 -1.36 0.02 -0.00 0.02 -1.76 -0.78 [-0.14] [0.72] [-0.25] [0.00] [-0.09] [0.37] [-0.33] [0.21] ECA Cross Support Costs 0.00 0.06* -6.64 -2.78 -0.00 0.06 -5.84 -2.57 [0.05] [1.65] [-1.61] [0.93] [-0.07] [1.58] [-1.48] [0.91] LCR Cross Support Costs 0.05 0.04 8.33* 6.93* 0.04 0.04 6.28 5.17 [1.46] [1.06] [1.65] [1.91] [0.98] [0.88] [1.30] [1.51] MNA Cross Support Costs 0.01 0.04 -4.36 -1.88 0.00 0.03 -3.84 -1.74 [0.33] [0.80] [-0.77] [0.46] [0.05] [0.75] [-0.70] [0.45] SAR Cross Support Costs 0.01 0.03 2.66 2.68 0.01 0.03 2.19 2.17 [0.33] [0.72] [0.50] [0.71] [0.17] [0.66] [0.43] [0.60] FPD Cross Support Costs -0.10*** -0.02 -11.55** -8.6** -0.09*** -0.03 -11.86*** -8.82*** [-3.35] [-0.82] [-2.44] [2.57] [-2.97] [-0.96] [-2.61] [2.76] HDN Cross Support Costs 0.00 0.05 -3.33 -0.8 -0.00 0.04 -2.51 -0.59 [0.15] [1.54] [-0.86] [0.29] [-0.17] [1.37] [-0.67] [0.22] PRM Cross Support Costs 0.06** 0.05* 7.47** 6.7** 0.03 0.03 4.16 3.53 [2.04] [1.82] [2.06] [2.56] [1.11] [0.91] [1.18] [1.40] SDN Cross Support Costs 0.02 0.01 0.01 0.31 0.00 0.01 -0.38 -0.02 [0.98] [0.48] [0.00] [0.15] [0.12] [0.43] [-0.13] [0.01] Other Cross Support Costs 0.04* -0.00 4.40* 2.9 0.02 -0.01 4.16* 2.64 [1.90] [-0.18] [1.69] [1.56] [1.09] [-0.41] [1.66] [1.49] Multi-Project 0.60** 1.29*** 78.93*** 86.15*** [2.53] [3.69] [2.62] [3.90] Multi-Report 0.61*** 0.44** 112.17*** 87.3*** [3.48] [2.38] [4.79] [5.28] Multi-Sector 0.48*** 0.24* 40.20** 33.44*** [3.67] [1.85] [2.19] [2.59] Core Report 0.52*** 0.76*** 115.55*** 97.79*** [2.90] [3.55] [4.85] [5.78] Population 0.09*** 0.02 22.33*** 15.78*** [2.89] [0.71] [4.88] [4.89] Low Income 0.06 -0.05 51.33* 33.62 [0.29] [-0.24] [1.67] [1.56] Lower Middle Income 0.48*** 0.02 136.07*** 93.09*** [2.59] [0.11] [5.00] [4.85] Upper Middle Income 0.59*** 0.24 130.60*** 94.91*** [3.12] [1.17] [4.65] [4.79] Constant 1.25*** -0.70** -191.3 1*** -0.58 -0.99 -647.32*** [4.39] [-2.38] [-3.91] [-0.82] [-1.32] [-6.03] Observations 1,580 1,580 1,5 80 1580 1,580 1,580 1,5 80 1580 Pseudo R-squared 0.0121 0.0342 0.0179 0.0602 Adj. R-squared 0.07 63 0.1 61 z-statistics in brackets *** p<0.01, ** p<0.05, * p<0.1 Note: Year dummies coefficients are not shown in order to preserve space. As in previous tables, more recent year dummies have decreasing coefficients and z-statistics. 31
 Which World Bank Reports Are Widely Read? Page 37 Page 39