
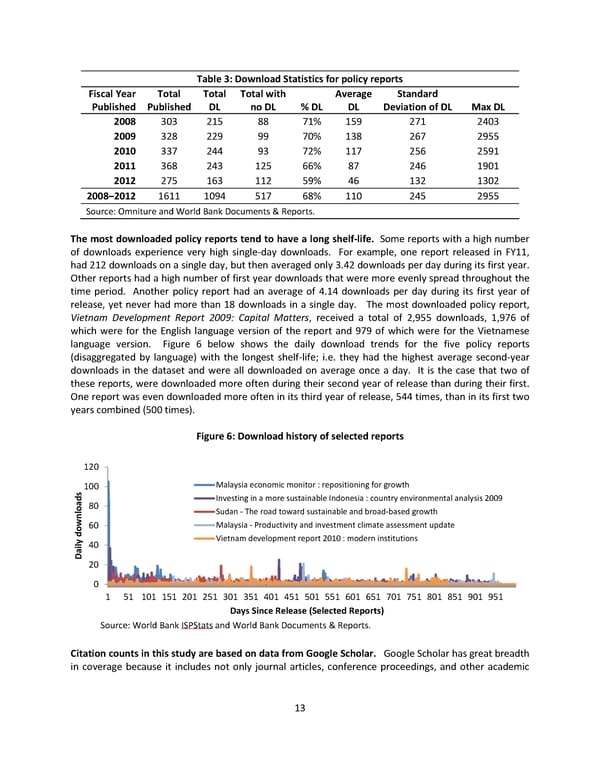
Table 3: Download Statistics for policy reports Fiscal Year Total Total Total with Average Standard Published Published DL no DL % DL DL Deviation of DL Max DL 2008 303 215 88 71% 159 271 2403 2009 328 229 99 70% 138 267 2955 2010 337 244 93 72% 117 256 2591 2011 368 243 125 66% 87 246 1901 2012 275 163 112 59% 46 132 1302 2008–2012 1611 1094 517 68% 110 245 2955 Source: Omniture and World Bank Documents & Reports. The most downloaded policy reports tend to have a long shelf-life. Some reports with a high number of downloads experience very high single-day downloads. For example, one report released in FY11, had 212 downloads on a single day, but then averaged only 3.42 downloads per day during its first year. Other reports had a high number of first year downloads that were more evenly spread throughout the time period. Another policy report had an average of 4.14 downloads per day during its first year of release, yet never had more than 18 downloads in a single day. The most downloaded policy report, Vietnam Development Report 2009: Capital Matters, received a total of 2,955 downloads, 1,976 of which were for the English language version of the report and 979 of which were for the Vietnamese language version. Figure 6 below shows the daily download trends for the five policy reports (disaggregated by language) with the longest shelf-life; i.e. they had the highest average second-year downloads in the dataset and were all downloaded on average once a day. It is the case that two of these reports, were downloaded more often during their second year of release than during their first. One report was even downloaded more often in its third year of release, 544 times, than in its first two years combined (500 times). Figure 6: Download history of selected reports 120 100 Malaysia economic monitor : repositioning for growth s Investing in a more sustainable Indonesia : country environmental analysis 2009 d a 80 lo Sudan - The road toward sustainable and broad-based growth n w 60 Malaysia - Productivity and investment climate assessment update o d40 Vietnam development report 2010 : modern institutions ily a D 20 0 1 51 101 151 201 251 301 351 401 451 501 551 601 651 701 751 801 851 901 951 Days Since Release (Selected Reports) Source: World Bank ISPStats and World Bank Documents & Reports. Citation counts in this study are based on data from Google Scholar. Google Scholar has great breadth in coverage because it includes not only journal articles, conference proceedings, and other academic 13
 Which World Bank Reports Are Widely Read? Page 18 Page 20