
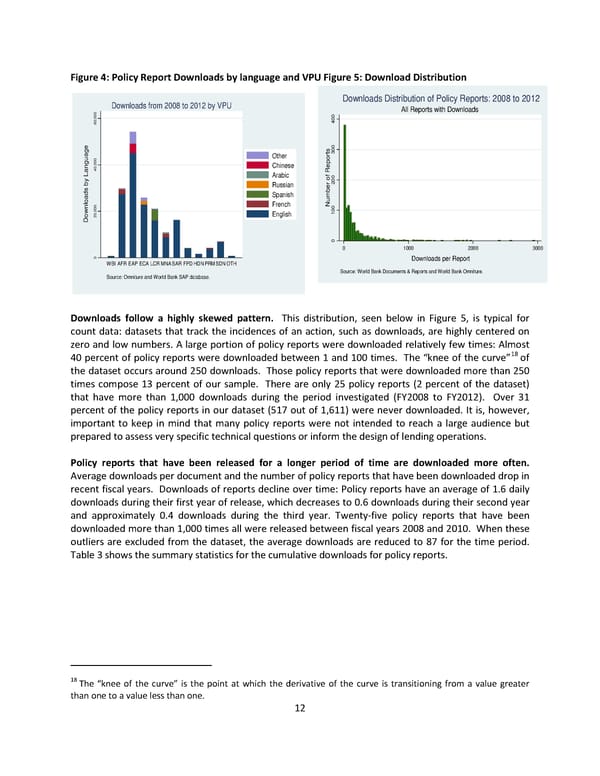
Figure 4: Policy Report Downloads by language and VPU Figure 5: Download Distribution Downloads from 2008 to 2012 by VPU Downloads Distribution of Policy Reports: 2008 to 2012 All Reports with Downloads 000 0 60, 40 s 0 age Other t 30 gu or 000 Chinese ep an 40, R L Arabic 0 y Russian of20 b er s Spanish b ad um lo French N 0 wn 000 English 10 Do 20, 0 0 1000 2000 3000 0 Downloads per Report WBI AFR EAP ECA LCRMNASAR FPDHDNPRMSDNOTH Source: Omniture and World Bank SAP database. Source: World Bank Documents & Reports and World Bank Omniture. Downloads follow a highly skewed pattern. This distribution, seen below in Figure 5, is typical for count data: datasets that track the incidences of an action, such as downloads, are highly centered on zero and low numbers. A large portion of policy reports were downloaded relatively few times: Almost 40 percent of policy reports were downloaded between 1 and 100 times. The “knee of the curve”18 of the dataset occurs around 250 downloads. Those policy reports that were downloaded more than 250 times compose 13 percent of our sample. There are only 25 policy reports (2 percent of the dataset) that have more than 1,000 downloads during the period investigated (FY2008 to FY2012). Over 31 percent of the policy reports in our dataset (517 out of 1,611) were never downloaded. It is, however, important to keep in mind that many policy reports were not intended to reach a large audience but prepared to assess very specific technical questions or inform the design of lending operations. Policy reports that have been released for a longer period of time are downloaded more often. Average downloads per document and the number of policy reports that have been downloaded drop in recent fiscal years. Downloads of reports decline over time: Policy reports have an average of 1.6 daily downloads during their first year of release, which decreases to 0.6 downloads during their second year and approximately 0.4 downloads during the third year. Twenty-five policy reports that have been downloaded more than 1,000 times all were released between fiscal years 2008 and 2010. When these outliers are excluded from the dataset, the average downloads are reduced to 87 for the time period. Table 3 shows the summary statistics for the cumulative downloads for policy reports. 18 The “knee of the curve” is the point at which the derivative of the curve is transitioning from a value greater than one to a value less than one. 12
 Which World Bank Reports Are Widely Read? Page 17 Page 19